Portfolio Analysis Guide: How to Analyze Your Stock Portfolio Performance

What is Portfolio Analysis?
Portfolio analysis is the process of evaluating your entire investment portfolio to understand its performance, risk profile, and diversification. Think of it like a health checkup for your investments—it helps you see the big picture, identify strengths and weaknesses, and make informed decisions about rebalancing or adjusting your strategy.
Our Portfolio Analysis tool provides comprehensive insights into your stock portfolio, including historical performance, sector allocation, risk metrics, and AI-powered recommendations. Whether you're managing a small portfolio or a large investment account, this tool helps you understand how your investments are performing as a whole.
Getting Started
The Portfolio Analysis tool offers two ways to analyze your portfolio:
Build Portfolio Manually
Enter stocks one by one with their allocation percentages. Perfect for planning or analyzing theoretical portfolios.
Upload CSV File
Import your actual portfolio from a CSV file. Supports Symbol, Quantity, and Value columns for easy import.
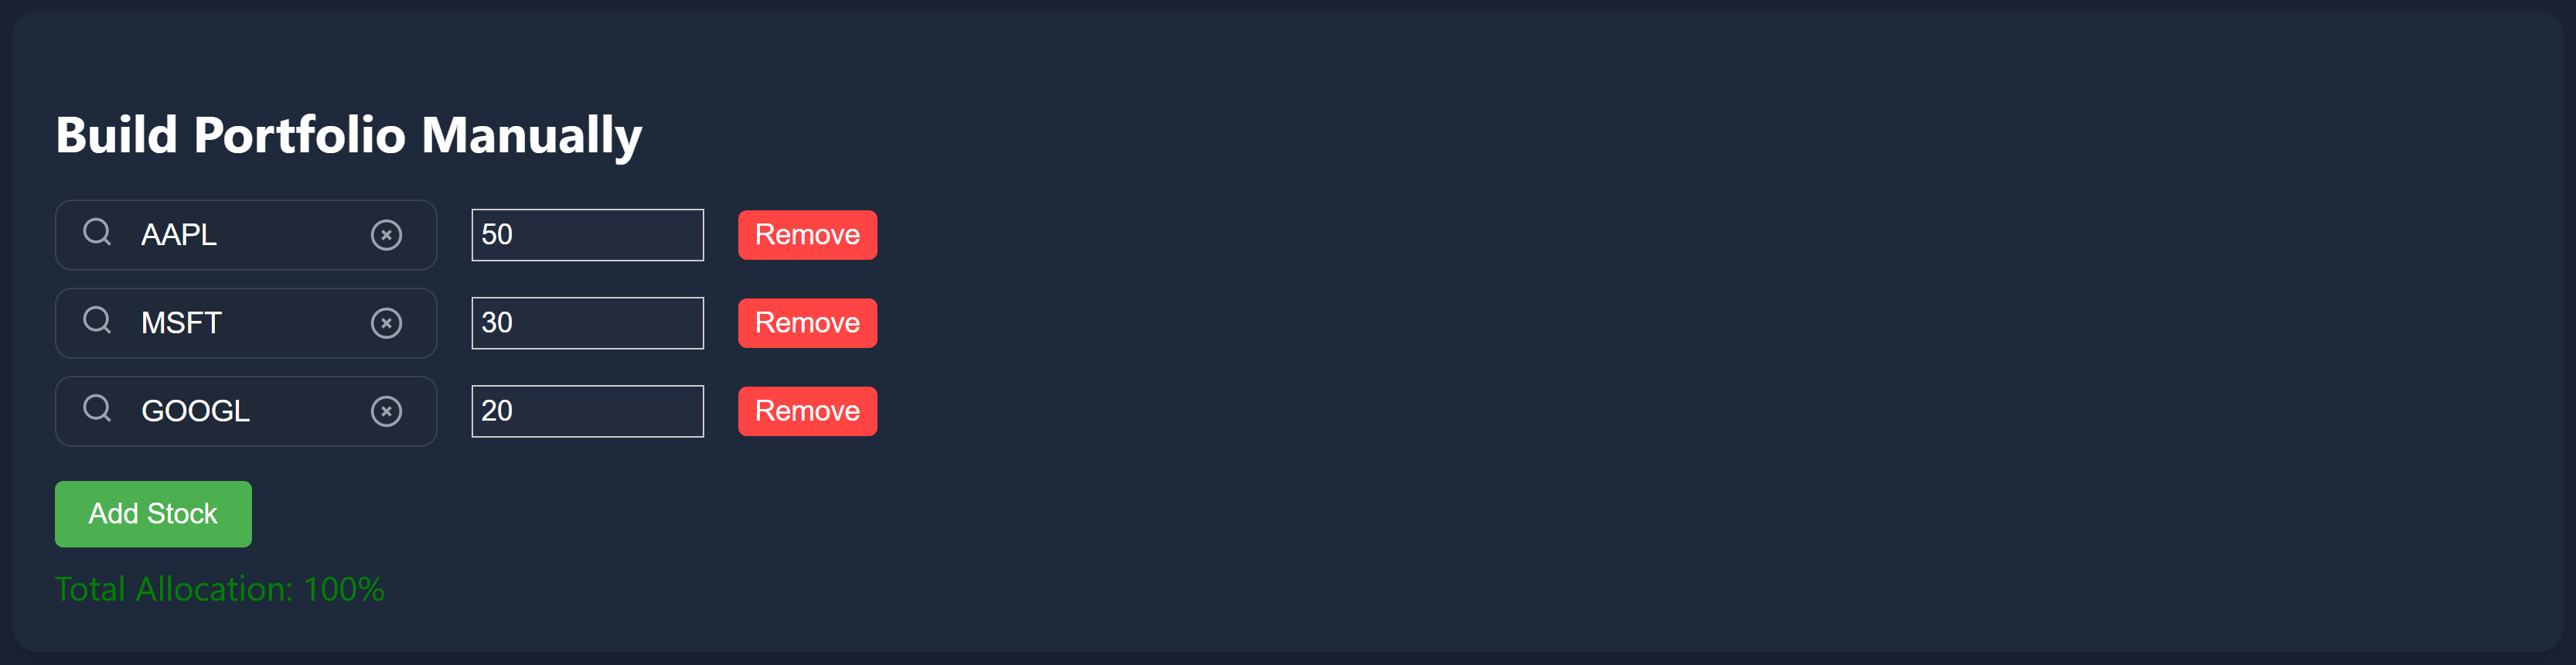
Building a Portfolio Manually
To build a portfolio manually, follow these steps:
- Enter stock symbols in the search boxes (one per stock)
- Set allocation percentages for each stock (e.g., 50% for AAPL, 30% for MSFT)
- Ensure allocations add up to 100% (the tool will warn you if they don't)
- Click 'Analyze Portfolio' to generate performance metrics and visualizations
Tip: Use the search box to quickly find stocks. The tool supports thousands of stocks from major US exchanges.
Importing Your Portfolio via CSV
CSV import is the fastest way to analyze your actual portfolio. Here's how it works:
- Prepare a CSV file with your holdings (see the example link on the portfolio page)
- Required column: Symbol (stock ticker like AAPL, MSFT)
- Required: Either Value (total dollar amount) OR Quantity (number of shares)
- Optional columns: Company Name, Sector, Industry
- Upload the file and click 'Analyze Portfolio'
How it works: If you provide Quantity but not Value, the tool automatically fetches current stock prices and calculates the total value for each holding. This ensures accurate portfolio analysis even with partial data.

Example CSV format:
AAPL,50000,186.24
MSFT,30000,60.38
GOOGL,20000,71.73
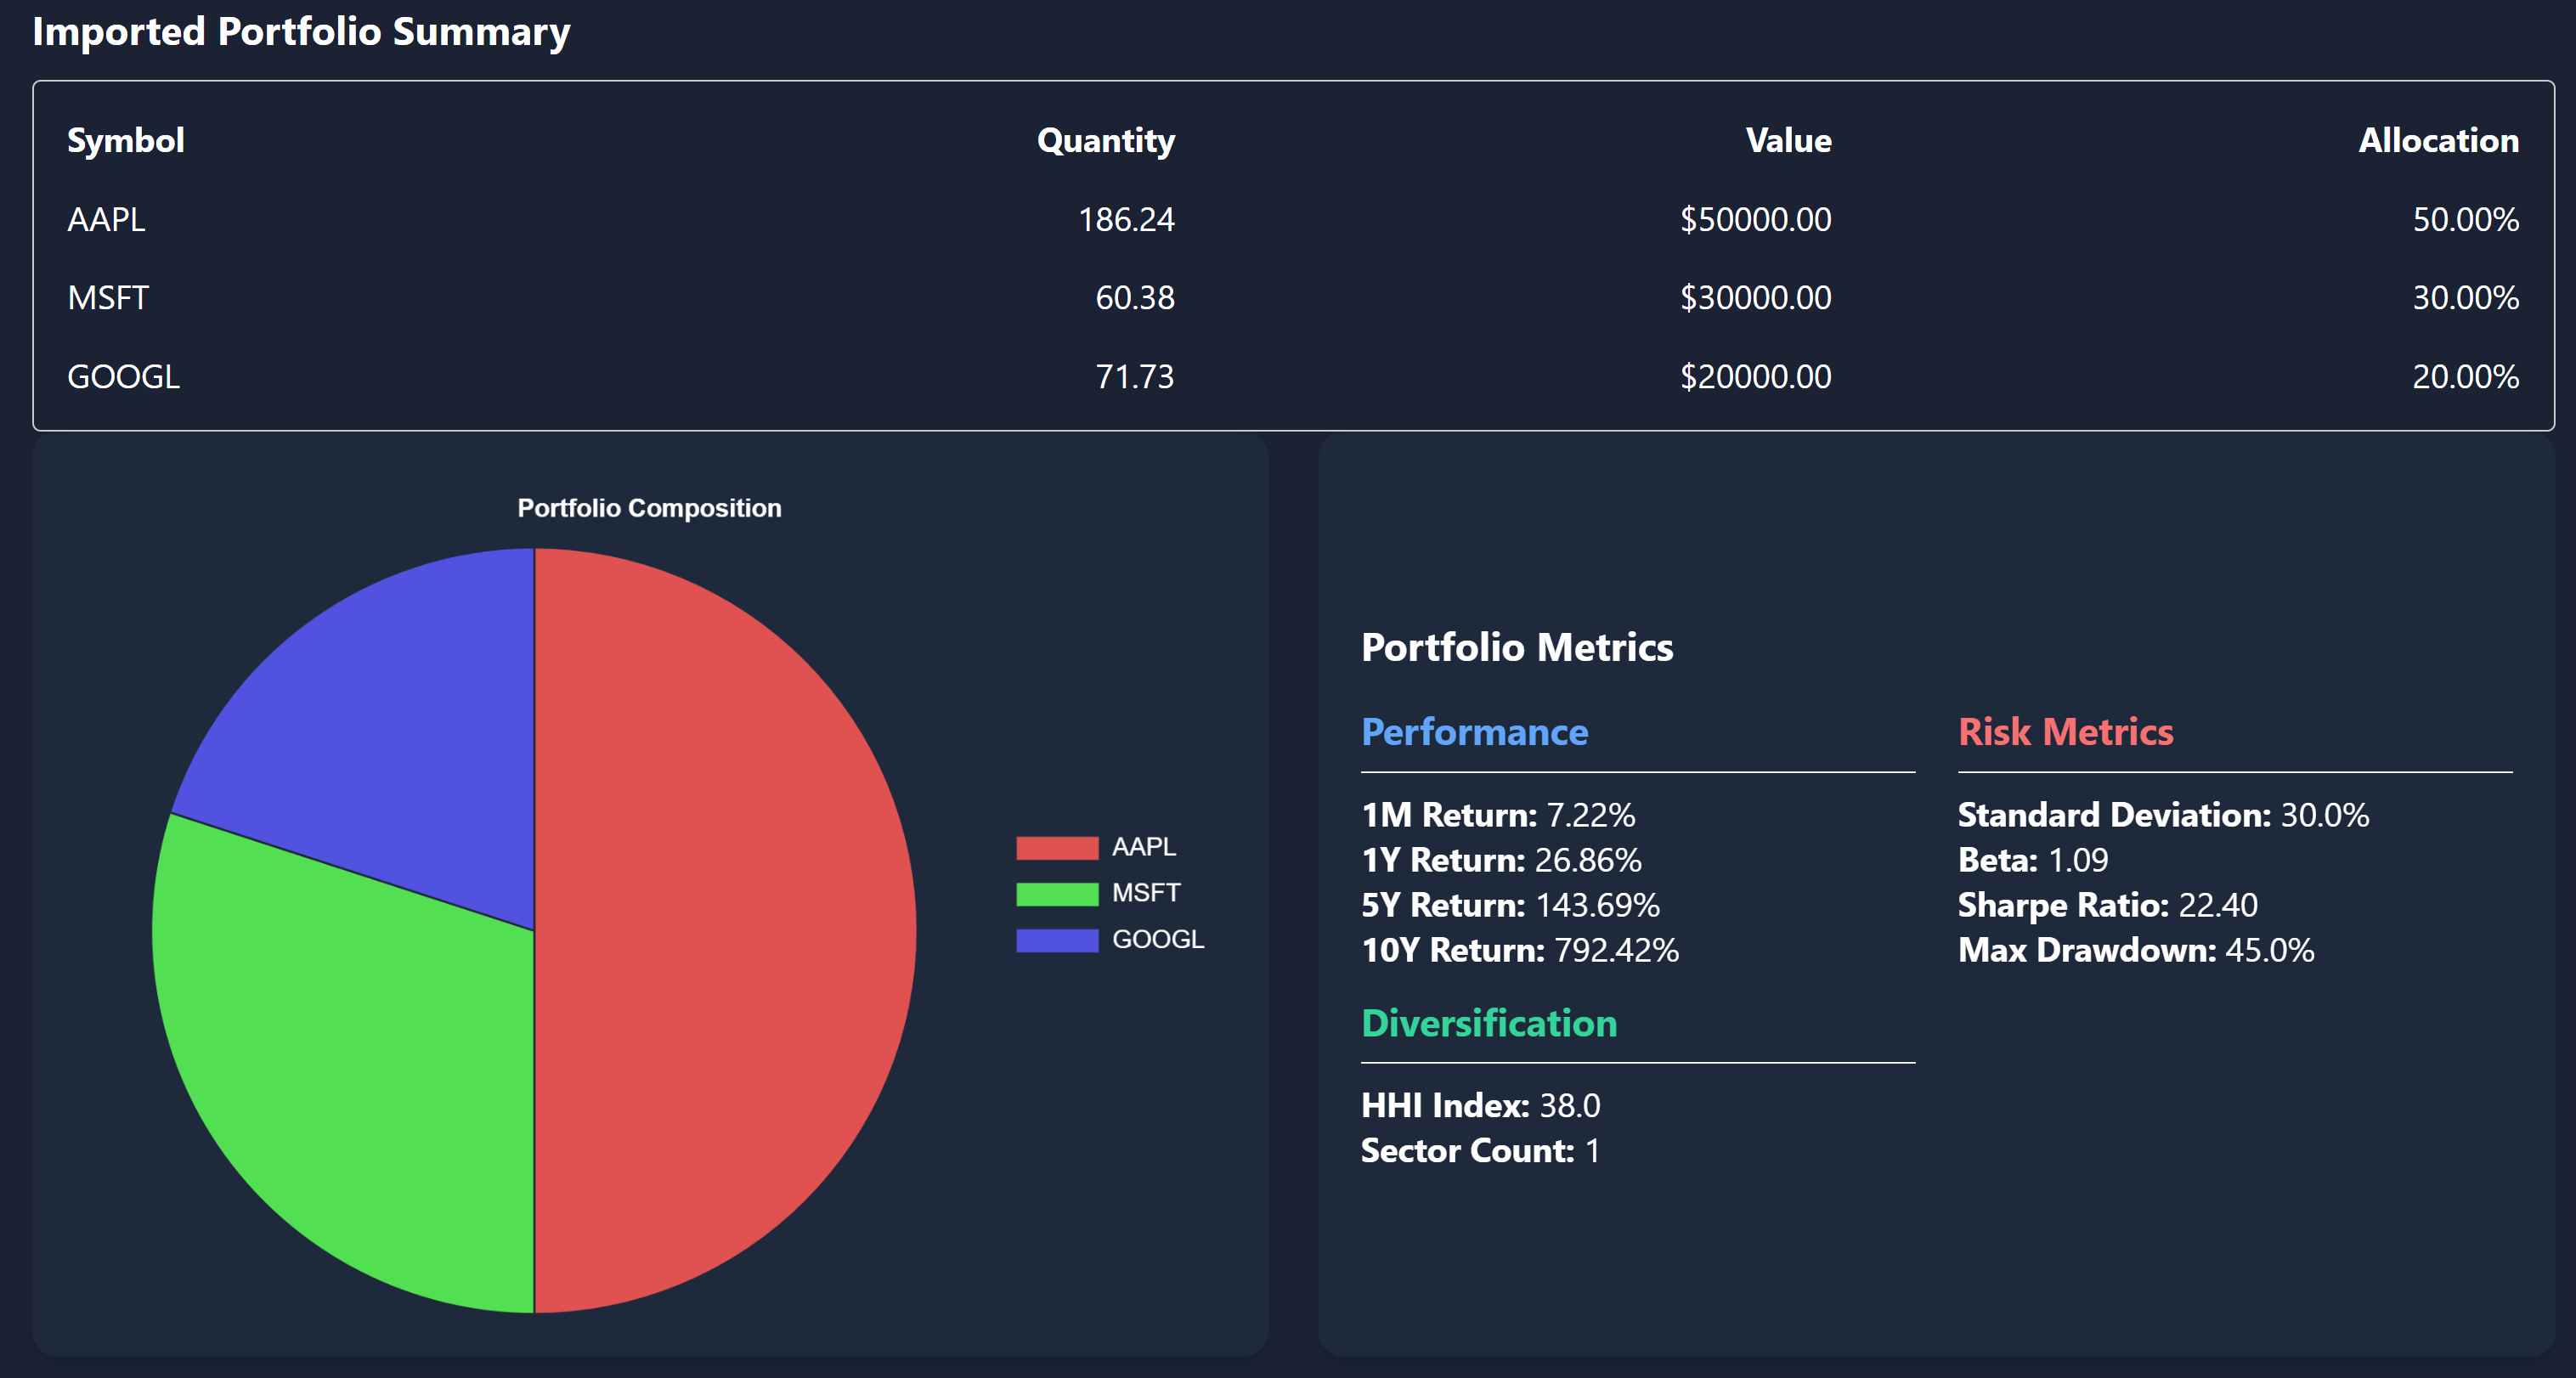
Understanding Portfolio Metrics
Once you analyze your portfolio, you'll see several key metrics:
Portfolio Value
The total current value of your portfolio based on current stock prices. This updates in real-time during market hours.
Historical Returns
Performance metrics showing how your portfolio would have performed over different time periods (1Y, 5Y, 10Y). Includes CAGR (Compound Annual Growth Rate) calculations.
Sector Allocation
Visual breakdown showing how your portfolio is distributed across different sectors (Technology, Healthcare, Financials, etc.). Helps identify over-concentration risks.
Stock Allocation
Pie chart showing the percentage allocation of each individual stock in your portfolio. Helps identify if you're over-weighted in any single stock.
Performance Visualization
The Portfolio Analysis tool provides visual charts to help you understand your portfolio's performance:
- Performance Over Time: Line chart showing how your portfolio value would have changed over 1, 5, or 10 years
- Allocation Pie Chart: Visual representation of stock distribution in your portfolio
- Sector Distribution: See how diversified (or concentrated) your portfolio is across sectors
Time Range Selection: Use the time range dropdown to analyze performance over different periods. This helps you understand both short-term volatility and long-term trends.
AI-Powered Portfolio Analysis
Our AI analysis feature provides intelligent insights about your portfolio:
- Risk Assessment: Identifies potential concentration risks and diversification gaps
- Performance Insights: Highlights top and underperforming holdings
- Recommendations: Suggests optimizations based on sector allocation and individual stock performance
- Market Context: Provides context about how your portfolio compares to market benchmarks
How to use it: After analyzing your portfolio, click the "Get AI Analysis" button to receive detailed, personalized insights about your investment strategy.
Best Practices for Portfolio Analysis
To get the most out of portfolio analysis, follow these best practices:
- Update regularly: Re-analyze your portfolio quarterly or after significant changes to track performance over time
- Check diversification: Ensure you're not over-concentrated in a single stock (>20%) or sector (>40%)
- Review historical performance: Compare 1Y, 5Y, and 10Y returns to understand long-term trends
- Use CSV import for accuracy: If you have many holdings, CSV import is faster and less error-prone than manual entry
- Consider risk: Look at sector allocation to ensure you're not taking unnecessary sector-specific risks
- Compare time periods: Analyzing different time ranges helps you understand both short-term volatility and long-term growth
Common Use Cases
The Portfolio Analysis tool is useful for:
- Portfolio Rebalancing: Identify which stocks need adjustment to meet your target allocation
- Risk Assessment: Understand concentration risks and sector exposure
- Performance Tracking: Monitor how your portfolio performs over time
- Tax Planning: Analyze which holdings have appreciated significantly
- Portfolio Planning: Test different allocation strategies before making actual investments
- Performance Benchmarking: Compare your portfolio's performance against market indices
Tips and Tricks
Allocation Warnings: The tool automatically warns you if allocations don't add up to 100% or if individual stocks are over-weighted. Pay attention to these warnings to ensure accurate analysis.
CSV Column Flexibility: The CSV parser is flexible with column names. It recognizes variations like "Symbol" or "Ticker", "Value" or "Total Value", "Quantity" or "Shares". Use whichever format is most convenient.
Historical Analysis: The tool uses historical price data to calculate returns. This means you can see how your current portfolio would have performed if you had held it in the past, helping you understand potential volatility.
Accessing the Portfolio Analysis Tool
To access the Portfolio Analysis tool:
- Navigate to the Stocks page from the main menu
- Click on 'Portfolio Analysis' in the analysis tools section
- Or go directly to: /stocks/portfolio
- You must be logged in to use this feature
Note: The Portfolio Analysis tool requires authentication. If you're not logged in, you'll be redirected to the login page.
Conclusion
Portfolio analysis is essential for making informed investment decisions. The BriMindInvest Portfolio Analysis tool makes it easy to understand your portfolio's performance, identify risks, and optimize your allocation strategy. Whether you're a beginner investor or a seasoned professional, regular portfolio analysis helps you stay on track toward your financial goals.
Start analyzing your portfolio today and gain valuable insights into your investment strategy. Remember to review your portfolio regularly and adjust as needed based on your financial goals and risk tolerance.
Unlock Full AI-Powered Analysis
Get AI prediction signals, unlimited stock comparisons, portfolio analytics, and personalized watchlists — free for 14 days, no credit card required.
14-day free trial · No credit card required · Cancel anytime